Consultant Spreadsheet | Project Profitability Tracker | Utilization Dashboard | Solo Consultant | Excel
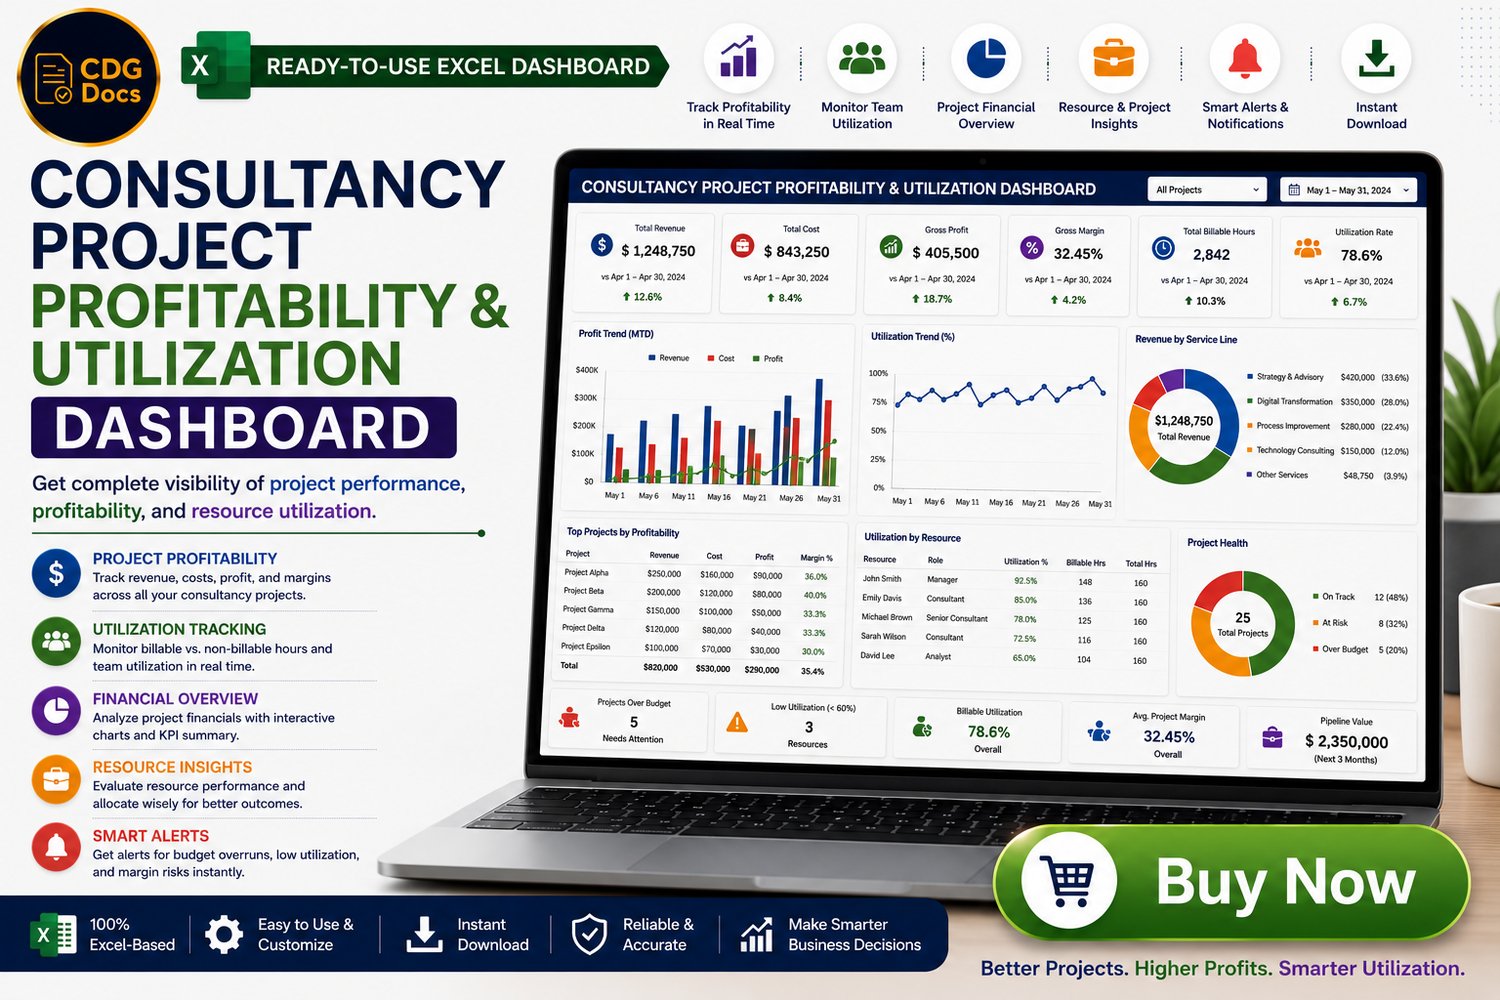
Consulting profitability depends on two things—utilization and margin. When billable hours, project costs, and delivery effort aren’t tracked in one place, projects can quietly lose money and teams can get overbooked. This Consultancy Project Profitability & Utilization Dashboard helps consulting firms track project revenue, billable utilization, and true profitability in one centralized system—so you can keep tracking in one place, protect margins, and allocate resources smarter.
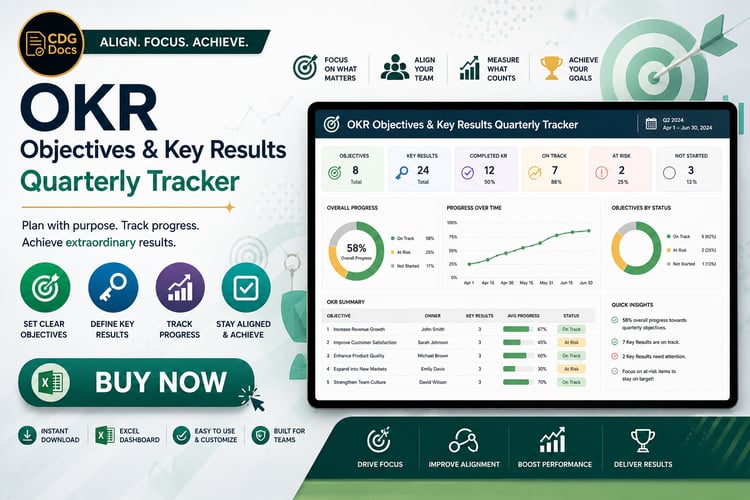
This is a ready-to-use, professionally designed, and fully customizable Excel dashboard created to simplify operations and improve profitability. It enables consultants and project managers to record project fees, track billable/non-billable hours, calculate cost of delivery (internal hours, contractor costs, tools), and monitor utilization % without complex PSA tools. Everything is structured to give you an at-a-glance view of project margin, team utilization, and which engagements are underperforming.
With automated summaries and clean reporting views, you can identify scope creep early, improve staffing decisions, compare profitability across projects, and create leadership-ready reporting for monthly reviews. Whether you run a strategy consultancy, IT services firm, HR consultancy, or boutique advisory, this dashboard supports stronger financial control and better utilization management.
What’s Included:
- Pre-built Excel dashboard for project profitability and utilization tracking
- Project master database (client, project name, fee type, start/end dates, status)
- Revenue tracker (retainers, fixed fees, milestones, time & material—customizable)
- Time log / hours tracker (consultant, date, hours, billable flag, task)
- Cost allocation fields (hourly cost rates, contractor costs, tools/subscriptions)
- Auto-calculated utilization % (billable vs available hours)
- Project margin and profitability summary (gross margin %, net profit—customizable)
- Project-wise and consultant-wise performance dashboards
- Month-wise utilization and profitability trend reports
- Fully customizable fields for your billing model and cost structure
Key Benefits:
- Centralizes project revenue, hours, and costs in one place
- Shows true profitability per project to protect margins
- Tracks utilization % to improve staffing and delivery planning
- Identifies scope creep and low-margin projects early
- Supports better pricing decisions using real delivery cost visibility
- Saves time with automated summaries and dashboard views
- Improves reporting for leadership and client performance reviews
- Ideal for consulting firms and professional services teams
Get your Consultancy Project Profitability & Utilization Dashboard today and streamline your consulting operations while maximizing margins, utilization, and customer satisfaction.